
Table of Links
A. Mathematical Formulation of WMLE
C Qualitative Bias Analysis Framework and Example of Bias Amplification Across Generations
D Distribution of Text Quality Index Across Generations
E Average Perplexity Across Generations
F Example of Quality Deterioration Across Generations
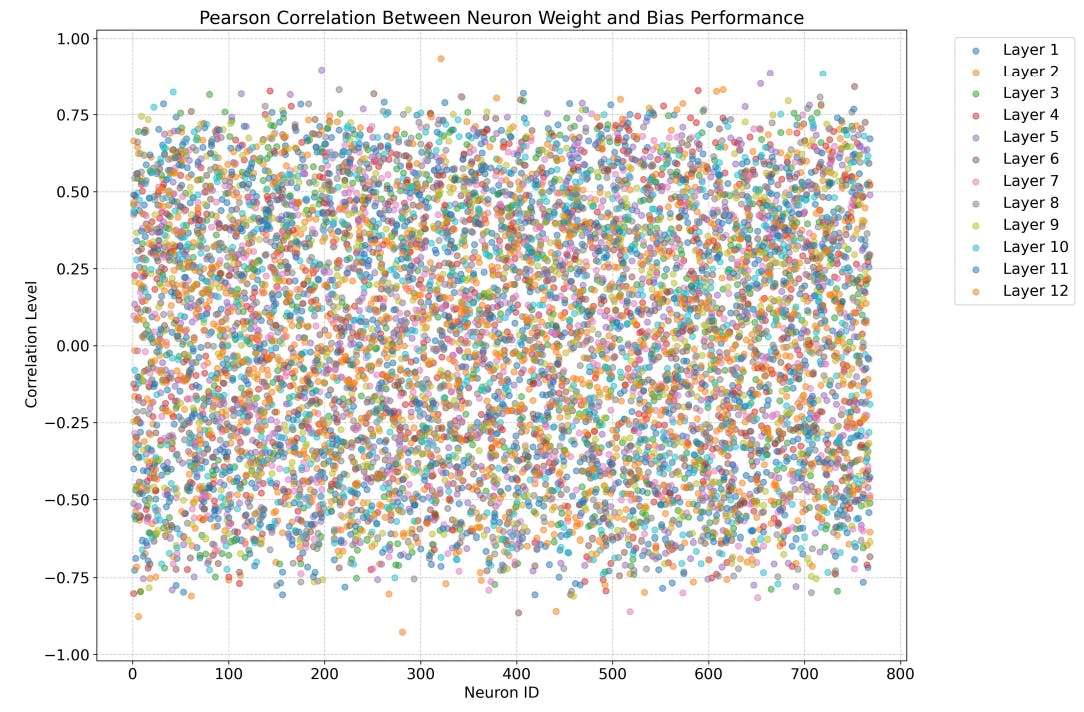
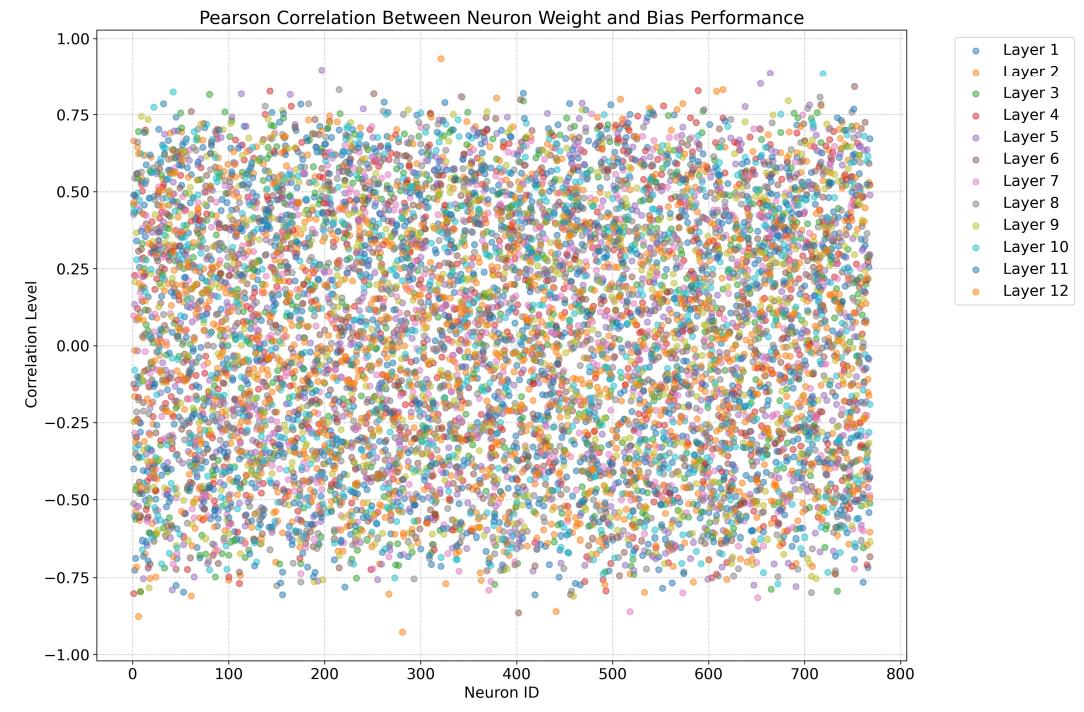
G Pearson Correlation Between Neuron Weight and Bias Performance
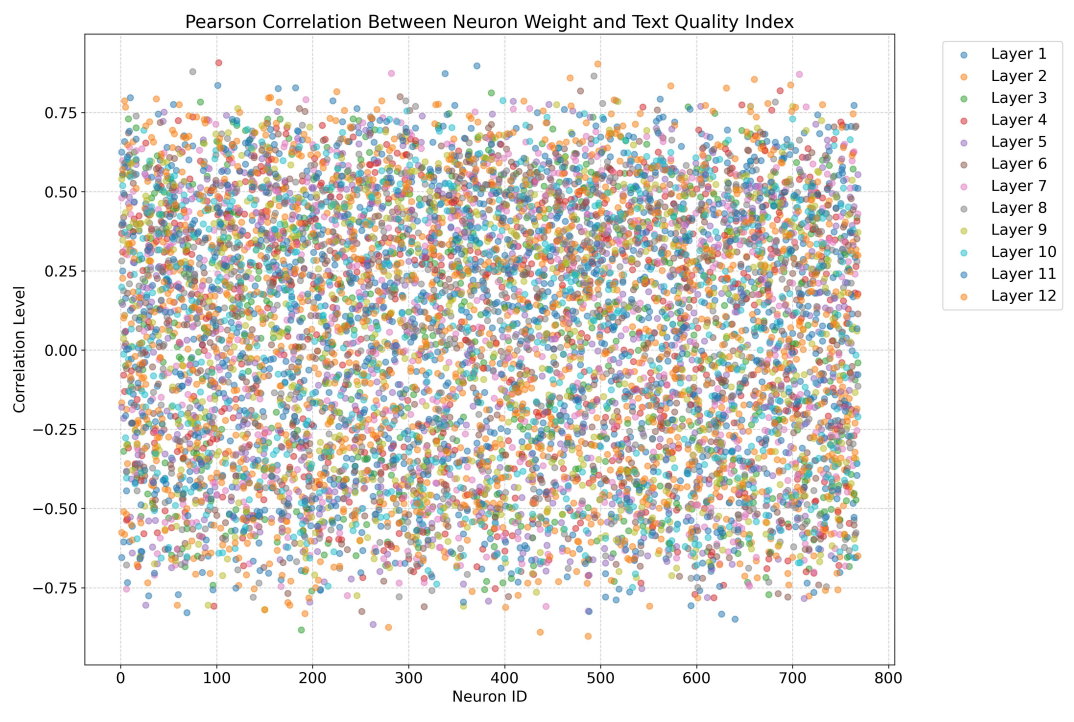
H Pearson Correlation Between Neuron Weight and Generation Quality
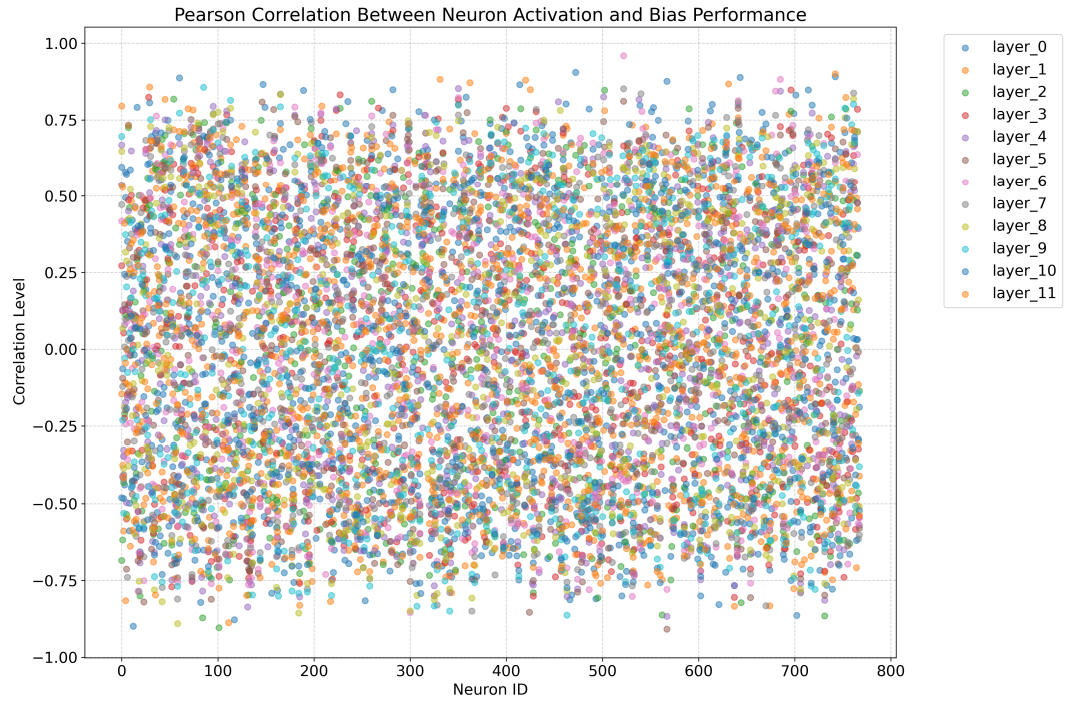
I Pearson Correlation Between Neuron Activation and Bias Performance
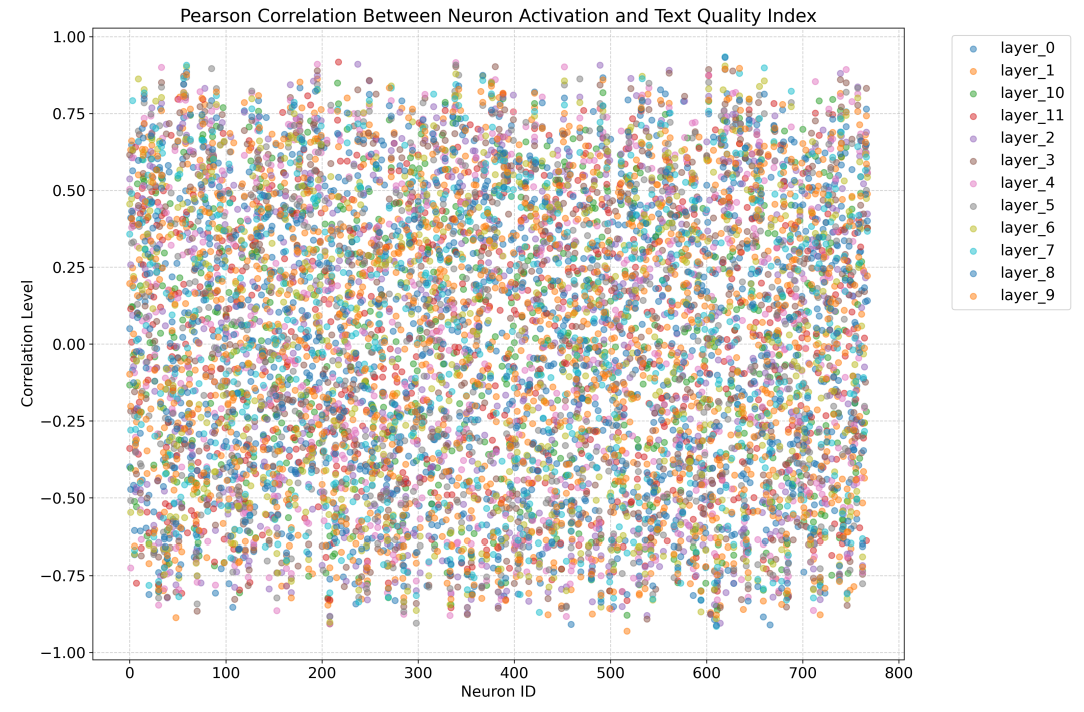
J Pearson Correlation Between Neuron Activation and Generation Quality
K Mathematical Details for the Statistical Tests
We will explain how the relationship between changes in neuron weight and changes in bias performance can be statistically tested. The same approach applies to the other three relationships discussed in Section 5.4.
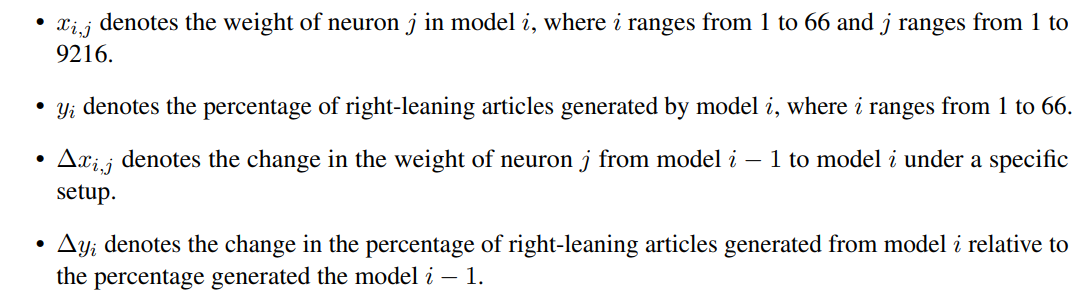
K.1 Notations
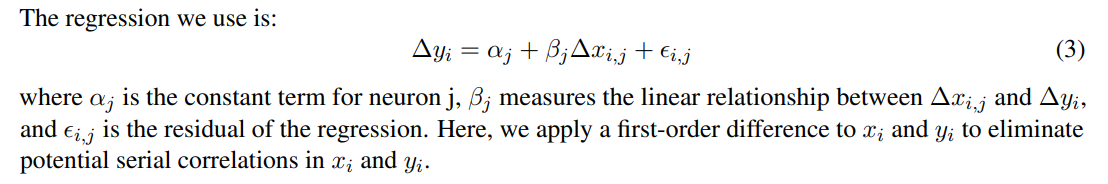
K.2 Regression
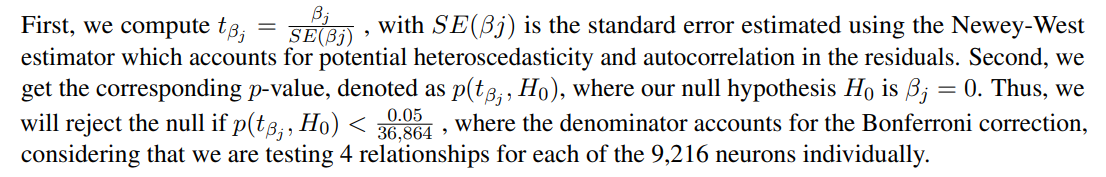
K.3 Statistical Test
L Literature Review of Model Collapse
Model Collapse. Shumailov et al. (2024); Alemohammad et al. (2023); Guo et al. (2024); Wyllie et al. (2024); Dohmatob et al. (2024a) describe it as a degenerative process in which models, recursively fed with their own data, increasingly distort reality and lose generalizability, for example, by prioritizing high-probability events while neglecting rare ones or shifting distributions. Shumailov et al. (2024), utilizing the OPT-125M, demonstrates this phenomenon, showing that the perplexity distribution becomes increasingly skewed, with more concentration at lower perplexities and longer tails. Taori and Hashimoto (2022) observed an increase in repetitive content during the synthetic fine-tuning of GPT-2. Similarly, Guo et al. (2024); Dohmatob et al. (2024b); Seddik et al. (2024) show that the OPT-350M, Llama2, and GPT2-type models experience performance deterioration after several generations, such as a decrease in linguistic diversity or greater divergences in token probabilities. Alemohammad et al. (2023) studies model collapse in generative image models, finding that quality and diversity deteriorate with synthetic training loops. They also found that cherry-picking high-quality outputs by users contributes to sampling errors, which actually helps maintain quality. Interestingly, Hamilton (2024) found that GPT-3.5-turbo shows less diversity in perspectives in narrative writing tasks compared to earlier models like davinci-instruct-beta and text-davinci-003.
Mitigation Strategies. There are three potential strategies to mitigate model collapse: (1) real data mixing, (2) training data concatenation, and (3) synthetic data pruning. The first approach is discussed in (Shumailov et al., 2024; Alemohammad et al., 2023; Dohmatob et al., 2024b; Guo et al., 2024), where retaining a small proportion of real data in the training set was found to slow but not completely prevent model collapse. Seddik et al. (2024) suggests that synthetic data should be exponentially smaller than real data to effectively halt model collapse, which has been shown to work with a GPT2-type model when mixing either 50% or 80% real data. The second strategy, examined by Gerstgrasser et al. (2024), involves concatenating real data with all synthetic data from previous generations to fine-tune the current generation. They show that this method prevents model collapse in several generative models, as indicated by cross-entropy validation loss. Lastly, Feng et al. (2024); Guo et al. (2024) proposed selecting or pruning synthetic datasets before fine-tuning the next generation. In the experiment conducted by Guo et al. (2024) with Llama-7B on a news summarization task, they showed that oracle selection of synthetic data outperformed random selection in terms of ROUGE-1 scores. However, filtering noisy samples using a RoBERTa model did not yield effective results.
Authors:
(1) Ze Wang, Holistic AI and University College London;
(2) Zekun Wu, Holistic AI and University College London;
(3) Jeremy Zhang, Emory University;
(4) Navya Jain, University College London;
(5) Xin Guan, Holistic AI;
(6) Adriano Koshiyama.
This paper is available on arxiv under CC BY-NC-SA 4.0 license.